TL;DR

Get backup power and energy gear delivered free with Prime
- Fast, free delivery on millions of items
- Prime Video, Amazon Music and more included
- Member-only deals all year
The U.S. Energy Information Administration estimates that small-scale solar generation rose from 18,812 gigawatt-hours (GWh) to 92,979 GWh over the decade ending in 2025. California produced 37% of the 2025 total, while growth continued in states including Arizona, Texas, Florida and New York; the annual growth rate has slowed since 2022.
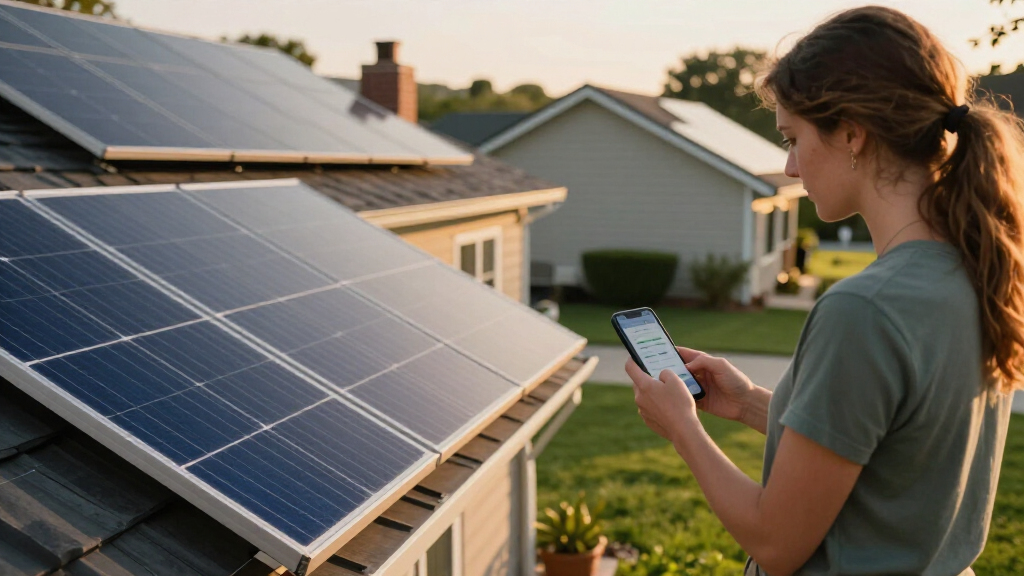
U.S. generation from small-scale solar rose from 18,812 gigawatt-hours in 2016 to an estimated 92,979 GWh in 2025, according to an Energy Information Administration analysis published October 16, 2026. The figures, which cover rooftop and other solar photovoltaic systems under 1 megawatt of capacity, show the sector’s output nearly quadrupled in a decade, though its annual growth rate has declined since 2022.
The 2025 total was led by California, which generated 34,411 GWh, or 37% of the national amount. The state’s small-scale solar generation increased 8% from 2024 to 2025, while its installed capacity rose from 18 gigawatts to 20 gigawatts. The EIA says the generation increase was largely due to added capacity.
Arizona ranked second, producing 5,795 GWh in 2025, more than 6% of the U.S. total. Its output grew 6% year over year. The state’s largest annual increase in the period cited by the EIA was 22%, from 2022 to 2023. The agency notes that Arizona offers a state income-tax credit of up to 25% for rooftop solar, along with other incentives.
Generation also expanded markedly in Texas and Florida. Texas increased from 391 GWh in 2016 to 5,408 GWh in 2025; Florida rose from 205 GWh to 5,198 GWh over the same period. Both states have property-tax exemptions and other programs, some of which vary by state or utility. New York ranked fifth nationally despite having less abundant solar resources than leading states, with growth supported by capacity additions, technology improvements and state incentives.
Rooftop Solar Spreads Beyond Sunbelt States
The figures show that small-scale solar has become a larger source of electricity generation across the United States, not only in states with especially strong sunlight. California’s 37% share makes it the dominant producer in the EIA estimate, while the growth in Texas and Florida illustrates how quickly output can rise as more systems are installed. New York’s fifth-place ranking points to another factor: state policy and technology can support deployment even where solar resources are less abundant.
The increase is relevant to electricity customers, utilities and policymakers because rooftop systems add generation on local distribution networks. Their output can affect how much electricity utilities need to supply from other sources, although the EIA analysis does not quantify those effects, customer savings or changes in grid reliability. The report measures generation, not the financial return of individual systems or the share of all U.S. electricity that rooftop solar provides.
The slowing growth rate also matters. Total generation continued to increase, but the EIA says the rate has declined since 2022. That distinction means the decade-long expansion should not be read as evidence that the same pace will continue. The report describes past generation and capacity trends; it does not make a forecast.
As an affiliate, we earn on qualifying purchases.
Capacity Growth and State Incentives
The EIA links changes in generation to the amount of installed capacity and to state programs that shape rooftop solar economics. California’s earlier Net Energy Metering 2.0 program remained available through April 2023 and offered higher compensation for electricity exported to the grid than the later Net Billing Tariff, also called NEM 3.0. Systems installed under NEM 2.0 were grandfathered into that arrangement. The EIA says this helped incentivize installations before the newer tariff took effect.
That policy shift coincided with a particularly strong national growth year. Small-scale solar generation increased 25% in 2022 compared with 2021, alongside record capacity growth, according to the agency. Changes in programs supporting rooftop solar partly explain the increase, but the EIA does not attribute the entire national rise to California’s policy or to any single cause.
These statistics are estimates rather than direct readings of every rooftop system’s output. The EIA surveys electric utilities about customers with small-scale solar installations and their combined capacity. Utilities may not know how much electricity those systems generate on their distribution networks, so the agency estimates generation using tools including the National Renewable Energy Laboratory’s System Advisor Model and PVWatts. It used data on commonly applied system tilt angles and orientations in California as inputs intended to represent systems in other states.
As an affiliate, we earn on qualifying purchases.
How Rooftop Output Is Estimated
The EIA’s state and national generation figures are estimates, because utilities do not necessarily track the electricity produced by rooftop systems on their distribution networks. The agency describes its modeling approach, but the analysis does not provide a direct meter reading for all systems or a margin of uncertainty for the headline total in the supplied material.
The analysis reports generation and capacity changes but does not establish how much of the increase resulted from any one incentive, technology improvement or other factor. It also does not provide a forecast for future deployment, a comparison of household costs and savings, or a measure of small-scale solar’s share of total U.S. electricity generation. Those questions cannot be answered from the figures presented.
As an affiliate, we earn on qualifying purchases.
Future Growth and Policy Changes
The EIA analysis is a retrospective report covering generation through 2025; it does not announce a new program or provide a projection. The next useful measure will be whether subsequent annual data show continued increases and whether the slower growth rate observed since 2022 persists. Future capacity additions and changes to state or utility incentives will help shape that trend, but their effects are not yet established by this report.
Readers should also distinguish new generation estimates from direct measurements: the EIA relies on utility surveys for customer counts and capacity, then uses modeling tools to estimate output. Later releases can update the picture as new survey information and annual generation estimates become available.
As an affiliate, we earn on qualifying purchases.
Key Questions
How much did U.S. small-scale solar generation increase?
The EIA estimates it rose from 18,812 GWh in 2016 to 92,979 GWh in 2025, nearly quadrupling over the decade.
Which state generated the most rooftop solar power in 2025?
California led with 34,411 GWh, equal to 37% of the U.S. small-scale solar total in the EIA analysis.
Why is New York among the leading states?
New York ranked fifth despite having less abundant solar resources than the leading Sunbelt states. The EIA points to capacity growth, technology improvements and state incentives as factors supporting its output.
Are the generation totals measured directly?
No. The EIA says utilities do not necessarily know how much rooftop solar generates on their distribution systems, so it estimates output using utility survey data and modeling tools such as PVWatts and the National Renewable Energy Laboratory’s System Advisor Model.
Is rooftop solar still growing as quickly as it did in 2022?
The EIA says annual generation growth has slowed since 2022, although total generation has continued to rise. The analysis does not forecast future growth rates.
Source: primary
Halloween Picks
halloween
As an affiliate, we earn on qualifying purchases.